Psychedelic Graphics 1: Rolling Hills
This is part 1 of a series on creating psychedelic-looking visuals, especially for animation and games. If you haven't yet, go read the introduction first, where I outline what UV coordinates are, what float/vec2/vec are, and a summary of how graphics get put on the screen. Afterwards, I invite you to continue with part 2.
Here's what we're going to build towards in this article :
Making something psychedelic
In the introduction, I mentioned that when you're deciding which color to put in each part of the screen, you're really not able to look at what the others are. All you know is what the coordinates are of your current spot. So how do you make anything? Like many crafts and systems, computer graphics starts with some basic techniques and combines them to make more complicated ones.
For example, if you know what part of the image/screen you're deciding the color for (the UV coordinate), then you know how far it is from the center (0.5, 0.5). If I point directly to the center of the screen, that has a UV coordinate of exactly (0.5, 0.5), which means the distance to (0.5, 0.5) is... 0. The UV coordinate (0.0, 0.5) (halfway up the left side) is 0.5 away from the center (normally, we use the Pythagorean Theorem to calculate it). If we use these values to create a color (e.g. distance 0.5 is used to make color (0.5, 0.5, 0.5)), then we have this circular pattern:
Why is it all grayscale? If all the color attributes red, green, and blue are all the same, then it will be a shade of gray (as we saw, (0.0, 0.0, 0.0) is black and (1.0, 1.0, 1.0) is white).
That's one basic technique. Here's another. Have you ever heard of sinusoids, from trigonometry? Many people have tried to forget that knowledge, I know. In math, sin (pronounced “sign”) will take any decimal number and put it somewhere between -1 and 1 on a curvy line. And it's continuous, so when you give sin numbers that are close together, they will be close together on the curvy line.
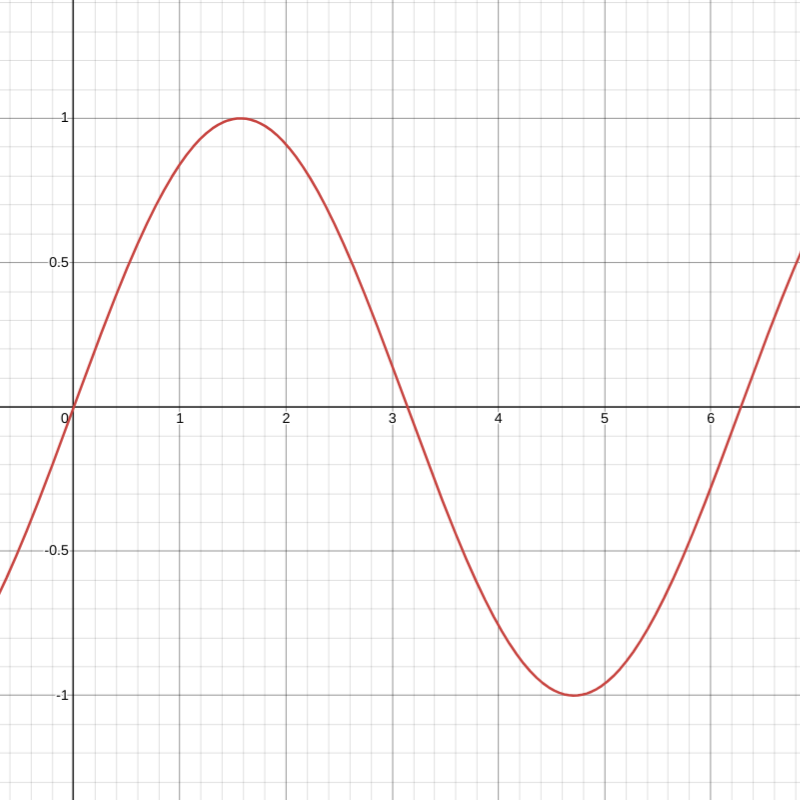
The sinusoid y = sin(x) (Desmos)
If you remember from math class, the sin of 0 is 0. Then it hits the top (1) when you give it about 1.5 (half of 𝜋). Back to 0 at about 3 (𝜋). And then it goes down to -1 and comes back up again at around 6 (two times 𝜋). Groovy man.
Suppose we take how far we are from the center and pass that to sin. It looks a tiny bit different, but not that different:
The reason is because the UV coordinates only span from (0, 0) to (1, 1), so the distance from the center maxs out at around 0.7, which isn't riding much of the sin wave. We want to go further along the sin wave. We need bigger numbers! Let's take the distance and multiply it by 50.0 before we pass it to sin:
OK it's getting weeeeeeeird. When you increase the value of something and then pass it to sin, you get a much faster curve. The furthest distance from the center is ~0.7, but when we multiply it by 50.0, it's now 35. sin goes up and down from 0 to 6, so by 35, it's already gone through almost six loops (and indeed you'll see the sixth ring in the image just above). Feel free to change 50.0 to 100.0 or 1000.0 in the interactive example above to see how it affects the image.
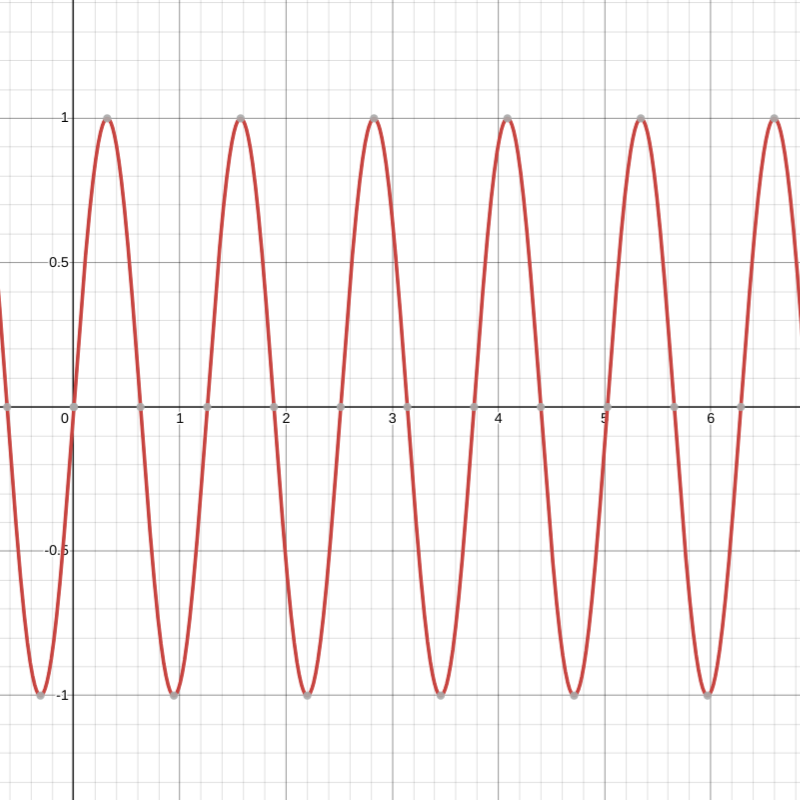
The sinusoid y = sin(4x) moves much faster than y = sin(x) (Desmos)
But is it psychedelic...? Not yet. If psychedelic art from the 1960s and 70s taught me anything, it's that color is very important. If you peeked into the code in the interactive example at the top of the page, you'll see I used this other thing called rainbow_gradient. Heh heh hee hee. rainbow_gradient is a thing that takes a number from 0.0 to 1.0 and gives you a color on the rainbow gradient (ROYGBIV red orange yellow green blue indigo violet).
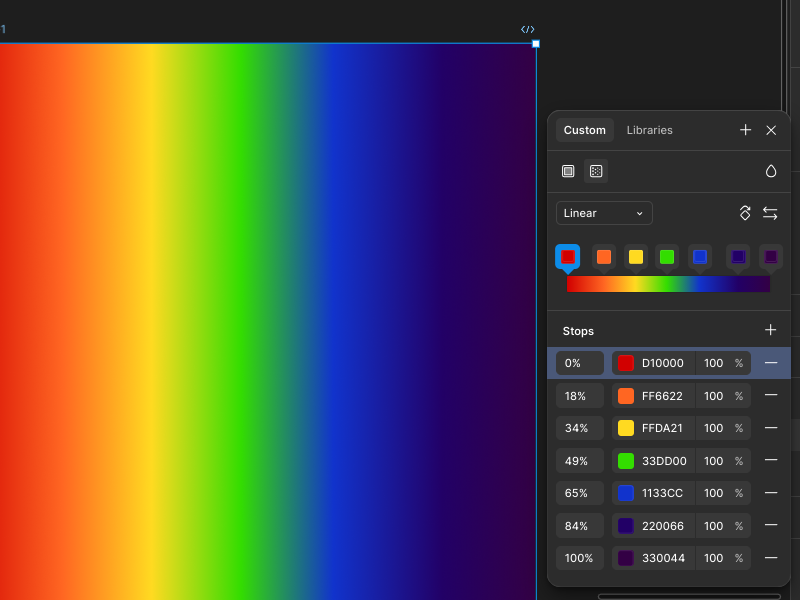
A color gradient of rainbow colors ROYGBIV
If you've ever done graphic design, it's not too dissimilar from those gradients. They continuously transition from one color to another. So what if we passed the brightness (the value from the sin curve) into this gradient. If we give it 0, we'll get something from the left side of ROYGBIV (red). If we give it something closer to 1, we'll get more violet:
Wait what... why is it so red? Because. It loves red. Actually, it's because sin goes from 1 to -1. Half the time, we're passing negative values to rainbow_gradient and rainbow_gradient is like, “OK, you gave me this negative... I don't know what to do with this. Let's just say it's 0 lol”. A simple way to fix this is to add 1 after we get the sin value. Then, instead of moving between -1 and 1, the value we pass to rainbow_gradient moves between 0 and 2. Next, multiply by 0.5. That will always give us a value between 0 and 1. This is a standard way to work with the output of sin and it's so common that I created sin01 to help us, which does this for us:
float sin01 (float value) {
  return (sin(value) + 1.0) * 0.5;
}
And here it is in action:
Stop here and celebrate wooooohoooooo!
Adding motion
Now comes motion. If you've ever drawn animation, you know that motion is kind of an illusion. You see something and it looks very similar to something else that was just there in a slighly different position mere milliseconds ago and you assume it's the same thing and that it's just moved.
We're going to do something like that too. We will create motion by using time. I am a bit of a purist and like to design my psychedelic graphics so all changes and movement are derived from the single value time. This is not a requirement, but I think it's beautiful. If you use Blender, you can create many different parameters and transition them between whatever values you like over time as they change aspects of your psychedelic graphics. In the past, I've done that as well. In this article, we're focusing on time. Specifically, the number of seconds that have passed since you opened this website.
This is the same as the previous rainbow-colored rings, only I added time (the number of seconds that have passed since you opened this website) before we passed the value to sin. So, instead of just taking the distance from the center and multiplying it by 50.0, now we are adding time. And time is always increasing. This is a hard concept to understand if you're new to it, but you will get it.
When time is 0, you're adding 0. A a millisecond later, time is now 0.001, and you're adding that. For every part of the screen, that little bit we're adding increases how far that part goes along the sin curve. Another millisecond passes and now time is 0.002 and everything moves a little further into the sin curve. Remember, you're drawing a completetly different image each time, but because sin repeats and is continuous, it looks like fluid motion.
Rotation mistaken for horizontal movement (Steve Mould)
If you want the motion to go faster, you can just multiply time by something. Like 5.0 or 100.0. Look at the code below. Change that time * 5.0 to time * 100.0 and see how the illusion of continuous motion is disturbed (I'm so sorry).
Pretending to move by adding to the UV coordinates
Honestly, I discovered so much about psychedelic graphics from just seeing a number like 0.5 and noticing what happened when I changed it to a value that changes over time.
For example, below I've added a line at the top uv.x = uv.x + sin(time) that gives time to sin and adds it to the X value in the UV coordinate. Why? Because I just wanted to see what would happen:
You may be squinting and confused. But think about it. What have we been using the UV coordinates for? To measure how far they are from the center of the screen. So, if we add to the X value, it's like we are pretending that everything is further to the right than it actually is. Even though our UV coordinate might be (0, 0), after we add some value to it, we've effectively moved to a different location for the rest of the calculations.
Then, when sin(time) gives us the negative values (the most negative is -1), it's like we are pretending that we're more to the left than we are. Because we're pretending to be further to the left, the rings get bigger because the distance from the center has increased.
Repeating with mod
Let's remove that last change and add another:
This time, we used mod.
uv.x = mod(uv.x, 0.2);
uv.y = mod(uv.y, 0.2);
In other programming languages, they'll often use % or fmod for this. Yet another name for this is “remainder”. mod takes a number and gives you what's remaining after you divide evenly by the second number. I used 0.2, which means that it will divide the X and Y values by 0.2 and any leftover is what you get. mod(2.0, 1.5) is 0.5, because when you divide 2.0 by 1.5, 0.5 is leftover.
So why does that give us this cool repeating square pattern above? Let's think about it. As the UV coordinate X value goes from 0.0 to 0.2, mod is like a mirror and gives back the same number we give it (0.0 to 0.2). But once the X value gets to the range 0.2 to 0.4, mod gives us 0.0 to 0.2 again, because that's the remainder when you divide by 0.2. Every 0.2, we repeat the values 0.0 to 0.2. So mod will take the X value and give back a new UV coordinate where X keeps repeating the values 0.0 to 0.2 as the original X increases. It does the same thing with Y. All these squares are masquerading as the square in the bottom left corner because, no matter where you are on the screen, the UV coordinates are always ranging from (0.0, 0.0) to (0.2, 0.2).
Bucketing with floor
Here's another way to create “squares”.:
In programming, floor usually throws away the decimal part of your number. Using floor, 4.5 becomes 4.0, 0.5 becomes 0.0, and 2.0 stays at 2.0.
uv.x = floor(uv.x / 0.04) * 0.04;
uv.y = floor(uv.y / 0.04) * 0.04;
floor is really handy in graphics for “bucketing” numbers that are close together. If you just use floor by itself without the / (divide) and * (multiply) operations that I added, it's basically “bucketing” numbers on the whole numbers: 1, 2, 3, etc. But if you first divide your number by something, throw away the remainder with floor, and then multiply by the same number you divided by, you're effectively rounding down to the nearest multiple of that number.
Let's suppose our expression is floor(0.8 / 0.5) * 0.5. Then 0.8 is divided by 0.5 to get 1.6. If we floor that to throw away the decimal part, it's 1.0. Then, multiply back the 0.5 to get 0.5. So 0.8 rounded down to the nearest 0.5 is... 0.5. Surprising!??
In the pixelized interactive example above, we round our UV coordinates down to the nearest 0.04. It's similar to mod, but it doesn't repeat, over and over. Instead, it jumps. All the values in the bottom left corner, from (0.0, 0.0) to (0.04, 0.04) will all be (0.0, 0.0). All the values in the top right corner, from (0.96, 0.96) up to (1.0, 1.0) will be rounded down to (0.96, 0.96). And so on.
This is also so common in my work that I made this its own thing:
float floor_to_nearest (float value, float step) {
    return floor(value / step) * step;
}
With this, floor(uv.y / 0.04) * 0.04 can be simplified to floor_to_nearest(uv.y, 0.04). It seems to be around the same number of characters, but your intention is more clear. And, if instead of 0.04 you use a more complicated calculation, you don't need to write it twice.
Using floor adds jumpiness and bucketing to an otherwise continuous range of numbers. If used in 2D, it can pixelize something into discrete blocks:
Sampling a texture
Messing with the UV coordinates and using that to choose a color is nice. But that is not how I made my videos. In almost all of them, there is an image or video shifting around. This is a texture, like the image textures we discussed in the introduction. Instead of putting it on a complex 3D model, we're going to be putting it flat on the screen.
How do we get a texture on the screen? When putting a texture on the screen, it's like there's a painting hanging on the wall and you're asking me for the color of the painting at a specific part. You could theoretically ask for the color of any part of the painting and I'd tell you what color it is. For now, you're just asking what color the painting is at the UV coordinates that you have right now. Therefore, if your UV coordinate is (0, 0) and you ask me for the the painting color there, I will go and tell you the color at the bottom left corner of the painting.
In our code, getting the color of the painting at a specific location is as simple as using painting in the code (normally, you have to use texture for this, but I created something called painting for learning purposes). I will use painting(uv) to get the RGB values of the image at that specific uv:
Previously, I said that you have to “coordinate” in a decentralized way. You may be wondering how can we just arbitrarily get the color of parts of a texture (the painting) in our graphics code? Well, preparing a texture is something you can do and use to decide what color each part on the screen will be. The important thing is that the texture does not change with each of the millions of little parts you have to decide the colors of on your big rectangle. This is also a hard concept to grapple with. Don't worry if you have trouble developing the intuition for it for now.
So we're able to look at the rolling hills using painting. Beautiful 👩🍳🤌💋. Those are the Blue Ridge Mountains in the Eastern United States. Wait! Something's not right. Are the mountains supposed to move like that?:
Perhaps you're starting to see the psychedelic aesthetic emerge? What did we add this time?:
uv.x = uv.x + sin(time + uv.x * 30.0) * 0.02;
uv.y = uv.y + sin(time + uv.y * 30.0) * 0.02;
Let's break this down, step by step. Before we look at the painting on the wall (painting), we change the UV coordinate. Changing the UV coordinate means we're pretending to be somewhere else on the screen and checking the color on the painting at our new location. Let's just look at the first line and ignore time. We are taking how far to the right we are (uv.x), multiplying that by 30.0, and passing that to sin.
If you remember back to our discussion of sin, increasing the value passed to sin makes it go up and down more. What we see above is just like the rings we made, only it's horizontal instead of circular. If that doesn't seem intuitive, I recommend you check out this Desmos example of y = sin(30x). value is what sin(uv.x * 30.0) gives us. How does it change as uv.x increases and goes to the right? It goes up and down many times. We are using that to make the color bright (closer to 1.0) and dark (closer to 0.0 or negative).
Next, we add the output of sin to the X value in the UV coordinate. In the black and white bars above, the center of the black bar is -1 (the color is (-1.0, -1.0, -1.0), which will get displayed as black) and the center of the white is 1 (the color is (1.0, 1.0, 1.0)). These values from sin, ranging from -1 to 1, then get added to the original X value in the UV (which is the default 0.0 to 1.0 value that represents how far to the right it is).
Just like before when our rainbow-colored rings were swaying left and right together, we are using the output of sin to help our UV pretend to be somewhere else. Only this time, the UVs are not changing/moving together; what comes out of sin depends on the location. It looks like there are about five vertical bars, so in the span of just one fifth of the screen, we've already gone from -1 to 1 and back to -1. That's a lot of pretending our UV coordinates are doing!
When you add these black and white bars to the UV, it creates this prism effect. Halfway between each black and white vertical bar is the value 0.0. As you move towards black, the UV coordinates there will pretend to be even further to the left, because we're adding a negative value to the X value of the UV. If you move towards the white, those UV coordinates will pretend to be more to the right, because we're adding a positive value to X. And this repeats about five times over the entire image.
The last part to notice is there's a little * 0.02 multiplication at the end. Without that, it'd look a bit much:
Now let's add back the time. The time just slowly moves the vertical bars slowly over time. It's like a blanket with things moving underneath it.
To finish off, we just do the same thing to the Y value, so there's a grid of vertical and horizontal bars moving. The image stays in place, but it appears to get bent/warped as the grid moves down and to the left. Here's what happens when we apply the effect full blast on X and Y:
Split the RGB wih chromatic aberration
Chromatic aberration creates that “old TV” look. In chromatic aberration, you are basically looking at what color the painting is, but looking at a different space for red, green, and blue before you combine them together to make a single color.
You can change the UV coordinate for red, green, and blue however you want before you look at the painting (the texture):
Let's break this example down. In that first section of code, we're choosing a different UV coordinate for the red, blue, and green!:
float value = sin(time) * 1.0;
vec2 red_uv   = uv + vec2( 0.0,    1.0) * value;
vec2 green_uv = uv + vec2( 0.866, -0.5) * value;
vec2 blue_uv  = uv + vec2(-0.866, -0.5) * value;
What's going on here? Chromatic aberration is when you move the UV coordinates seperately for each of red, green, and blue. What are 0.866 and 0.5 doing here? I chose these three values because it will evenly push the UVs away from each other, like the points of a triangle. Look at the places where the arrows point to below... it's the values we're adding to the UV coordinates above:
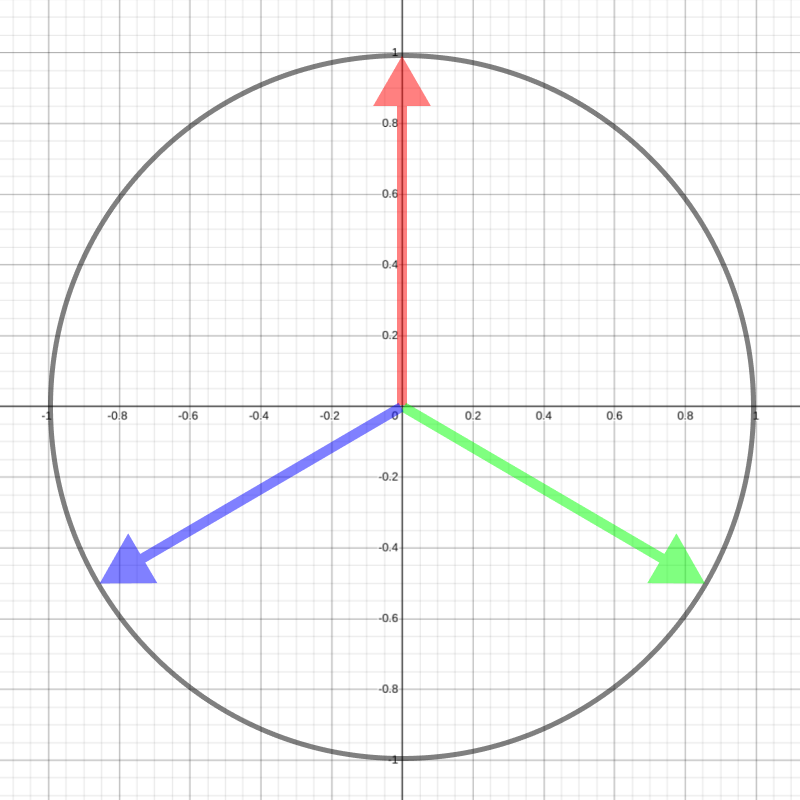
The red, green, and blue UV coordinate are pushed in different directions
Specifically, when sin(time) peaks at -1 and 1 during it's up and down movement over time, the red, green, and blue UV coordinates will have moved a distance 1.0 from where they started (the length of each colored arrow in the image above).
All we have is three separate UV coordinates for now. The next step is to consult painting to get the color of the painting at each of the these three coordinates.
color = vec3(
    painting(red_uv  ).x,
    painting(green_uv).y,
    painting(blue_uv ).z
);
Let's start by looking at just painting(red_uv).x. In the past, we used uv.x and uv.y. Now, we are getting the X value of painting. In truth, all vec2s and vec3s have .x and .y (not just uv), which refer to the first and second value in the vec2 pair and vec3 triplet. All vec3 also have a third value as well: .z. painting gives us a color, an RGB vec3 with red, green, and blue. If we want, we can use .x to pull out just the amount of red in that part of the painting and visualize it:
If you remove the // on one of the other lines where color is set, you'll see everything change color. Why? Because red here is just a decimal number (a float). We can take the amount of red and pretend it's the amount of green or blue. So this code...
color = vec3(
    painting(red_uv  ).x,
    painting(green_uv).y,
    painting(blue_uv ).z
);
is taking the amount of red at location red_uv on the painting and using it as the red color (the first slot of the vec3 is for red), the green_uv location to get the green and put it into green (the second slot of the vec3), etc.
It's actually quite well-behaved like this! Consider that we didn't have to put red into red, green into green, blue into blue. Instead, we could put blue into red and red into blue:
In the above interactive example, try switching those .x .y .z around. You can even just make them all .x. Different parts of these rolling hills are represented with different colors, so most objects will stand out more in one channel (e.g. grass in green, sky in blue).
Change colors with HSV
As you've seen, there are a variety of ways to construct and change colors in graphics like passing a decimal number to rainbow_gradient or mixing colors from painting. The last one I want to introduce is shifting the HSV (hue, saturation, and value).
There are many ways to represent color and HSV is one of them. I am not a color expert, but this is how I understand HSV: Hue loosely represents where it falls on the colors of the rainbow, saturation represents how colorful it is (high saturation) or how black and white it is (low saturation), and value is like brightness.
I've provided both rgb2hsv (RGB to HSV) and hsv2rgb (HSV to RGB) so that we can easily convert colors between these two formats. When you get a color in HSV format, it's still a vec3 triplet, but the .x .y .z values no longer represent how much of red, green, and blue they have respectively, but which hue, how saturated, and how bright the color should be (still between 0.0 and 1.0).
Disco, anybody? Let's look at float hue = mod(time, 1.0). One nice thing about hue in HSV is that it's circular, so if you have a color with a hue of 1.0, it's identical to a hue of 0.0. This is why there's a mod here. While time continues to go up, mod(time, 1.0) will cycle through 0.0 to 1.0, over and over. Using this as a hue means we'll see a continuously transitioning color.
Next, we construct an HSV color vec3(hue, 1.0, 0.5). I gave our HSV color a saturation of 1.0 and value (brightness) of 0.5. Feel free to fool around with these values to see how saturation and brightness work. Finally, we use hsv2rgb to get an RGB color, because color needs that.
Predictably random
Sometimes seeing the colors of the rainbow in the ROYGBIV order can be a bit boring. We need to introduce some randomness:
Now we've got... random. random is not actually random. If you give random the same vec2 twice, the two numbers it gives you back will be the same. But! The numbers it gives you back are so different than what you give it that it's perceivably random.
The first few lines with pixel_size and pixel is something we've seen before... We are just rounding all the UV coordinates down to the nearest 0.05 here.
Next, when we pass it to random, random gives us back a predictably random value between 0.0 and 1.0. You can visualize the random values if you remove the // in the last line. Finally, we construct another HSV value, this time using the value random gave us as the hue, before we convert it to RGB with hsv2rgb. Since each of these little squares has a random hue, the RGB values also look pretty distinct from each other.
I actually do this a lot in my psychedelic graphics:
- Use floor to round numbers down. This is important because, otherwise, step #2 just looks too random
- Give these bucketed, rounded numbers to random. If you don't have a vec2, you can make one with the first and second value the same e.g. random(vec2(my_value, my_value))
- Use this random value to create a color
Here's a visualization of what happens when you increase and decrease the number you're rounding to with floor:
And then, when you bring in the randomness with random, it can often put colors in unexpected places. Because we've already used floor to bucket, there are more distinct areas showing up instead of too much noise:
Putting it all together
Here's the example from the top again:
Let's go over what's happening:
- Change the UVs so that they pretend to be other, nearby UVs. This creates a shifting, prism effect.
- Get the red amount in the rolling hills painting.
- Round the red amount to the nearest 0.05, then use random to give each band of the red color a random value between 0.0 and 1.0.
- Use the random values from random to get a color of the rainbow.
- Convert the color to HSV. Add a slowed down time to the existing hue and use mod to make it loop through the values 0.0 to 1.0 as time increases.
- Convert the color back to RGB.
One thing we didn't talk much about is rgb2hsv. rgb2hsv works like the opposite of hsv2rgb and takes a color in RGB format and gives you the color in HSV format. It's all just math. You can keep converting a color back and forth until the cows come home: rgb2hsv(hsv2rgb(rgb2hsv(hsv2rgb(rgb_color))))
If you've made it this far, you've done an amazing thing and hopefully developed some intuition for how graphics are made and how they are made weeeeeeeird. Thanks for giving me a few minutes of your time! Would love to hear your questions, comments, or how you're using these ideas in your own work: ulysse at benpence.com. Or continue on to part 2, where I introduce many new techniques. At this point, you're also ready to start applying effects to your own videos using Blender in part 3.