Psychedelic Graphics 3: Jellyfish
This is part 3 of a series on creating psychedelic-looking visuals, especially for animation and games. If you haven't yet, go read the introduction and part 1 first.
This article will focus on applying what we've done so far in Blender, so you can beautify your Blender animations with it or apply these effects to your own video files. We won't be using many of the more advanced techniques from part 2, but you can certainly migrate anything you learn there to Blender.
In this part, we're going to take this video of jellyfish:
and convert it into this more stylized video using Blender:
And here's how we represent this in Blender. Don't worry if you don't understand any of it yet:
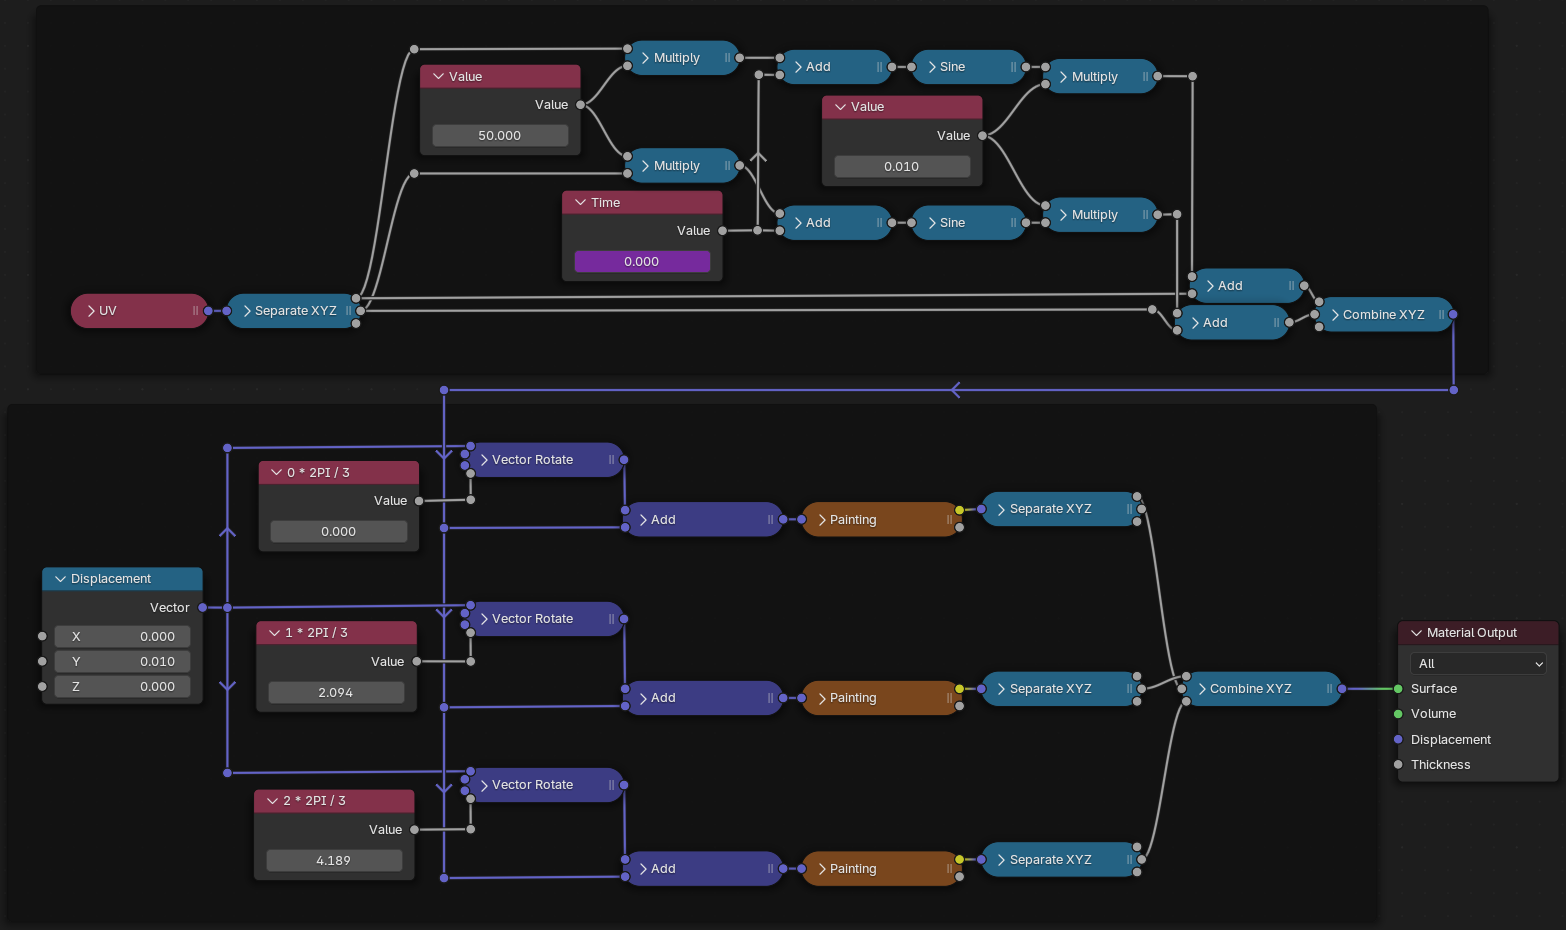
The drag-and-drop graphics language in Blender that produces the video above
You can follow along in your own installation of Blender with this .blend file and video (I'm using Blender 4.3.2, but the techniques described here are backwards compatible for older versions going back many years).
Node basics
Where to start? UV coordinates! Just like the code we wrote in part 1, everything we create using this visual graphics scripting language in Blender is will happen for every part of the rectangle/screen. You only need to figure out how to do it for one UV coordinate and Blender will use that everywhere.
However, unlike the code in part 1, where the data moves from the top line to the bottom, from the inside of the parentheses ( ) to the outside, in Blender, the data travels from left to right. The data travels through “nodes”. Like our sin, floor, etc. from part 1, each node (see the grey boxes below) can take in data and use it to give off some data. Here are four examples of nodes:
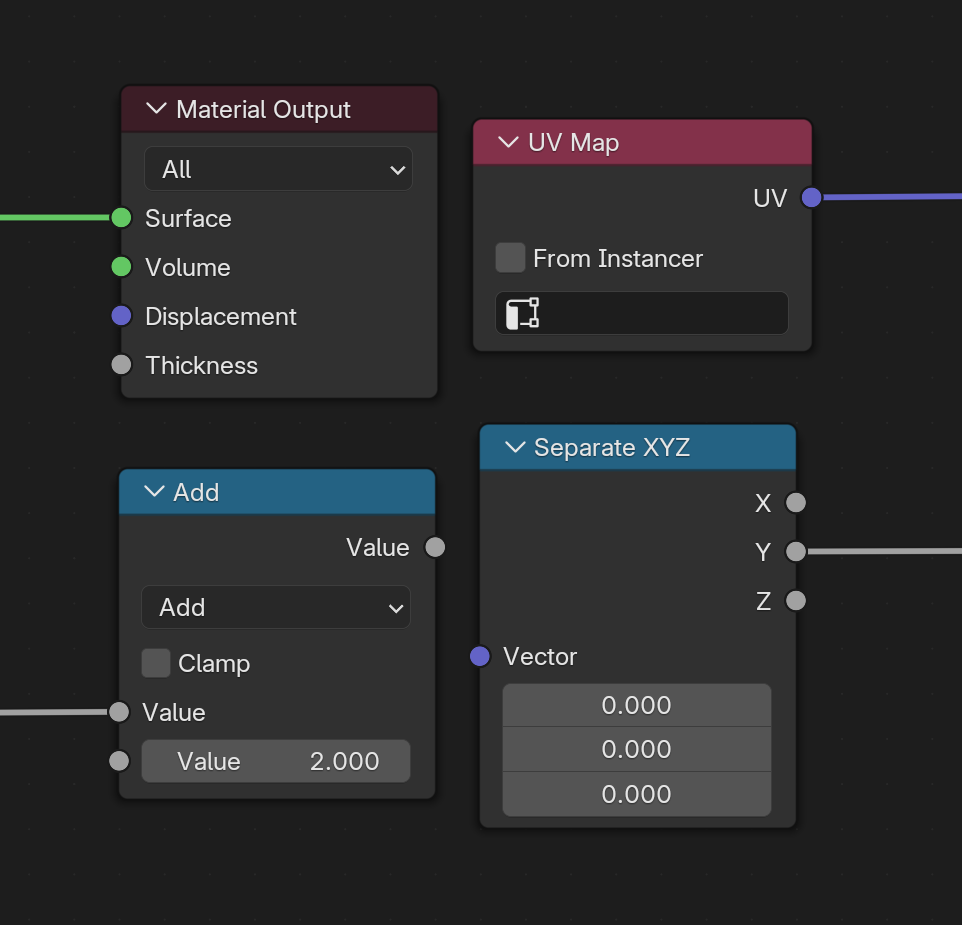
Material Output can take in four data. UV Map gives off one data. Add can take in two and give off one. Seperate XYZ can take in one and give off three.
You may have noticed that some of the colors of the little circles where data comes in (the left side of a node) and data goes out (the right side of a node) are different colors. The colors correspond to what kind of data they take in. Purple is for vec3, grey is for float, etc.
How data flows
Some nodes also have lines coming in from the left or going out the right. What's up with that? Those lines are like pipes by which data flows from left to right. But how does the data flow? And when does the data flow? 🤔
All these nodes we connect together are inside one material. Each of the interactive examples from part 1 was also a separate material. To figure out how data flows, we start by looking at the Material Output (which is the furthest node to the right). In Blender, the Material Output node like our color = expression in the part 1 interactive examples.
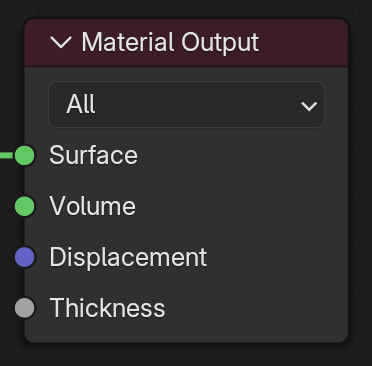
Material Output is the last node in a material and acts like the color = expression from part 1
Blender looks at what data should be coming in to the Material Output from the left. For all the incoming data pipes (the lines), Blender will then follow those pipes left, back to where they are coming out of other nodes, to figure out what data they contain. The process repeats for those nodes and goes on until coming across a node that has no incoming data (lines coming in to circles on the left), like this UV Map node below.
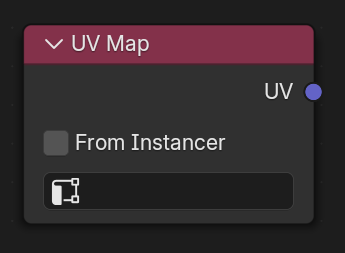
These nodes don't depend on others (there's no little circles on the left to receive data) and therefore Blender can figure out what data they're giving out. Blender can then figure out what data comes out of the nodes it connects to, and so on. Rinse, repeat until we get back to the Material Output. It's a simple dependency system (search “topological sort” for more info).
So that's the how the data flows. The when is that data moves through the pipes/lines like this once for every frame of the animation/video, for every part of the screen. It is just like the interactive examples from part 1, but we are using a drag-and-drop interface. So, specifically for the UV Map node, it will only push one data through the lines coming out of it once for every frame for every part of screen.
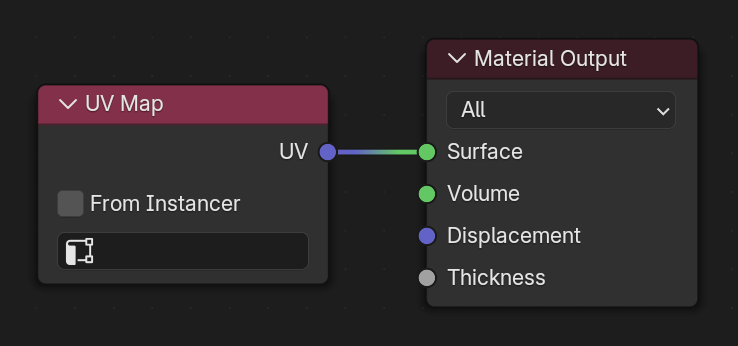
A material in Blender that uses the UV Map node to visualize the UV coordinate
In the case of UV Map, if you connect it to something, it gives out a vec3 (the purple dot is vec3). Why not a vec2 for the X and Y values in the UV coordinate? Because Blender doesn't have vec2 🤷♂️. So the third and last value in the vec3 that UV Map gives out will be 0.0. The material above with the UV Map and Material Output is exactly like our example from part 1:
But wait, you say, doesn't UV Map give off purple data (vec3) and Material Output take in green data (a closure... don't worry, understanding what a closure is is not important for this article)? Yup. Unlike the code we wrote in part 1, Blender has quite a bit of flexibility with automatically converting data when it moves through the pipes. We'll talk about using that when it comes up.
But wait, you say, you said data moves left to right and the first material you showed was stacked vertically, wasn't it? Yup. Although the nodes take in data from the left and give off output to the right, you can move the nodes wherever you want. Moving nodes without changing how the data flows has no impact on the final video. Additionally, you can use those little anchor points (Reroute nodes) that are just floating in space to lay out the connections between nodes more clearly. Note the direction of the arrows... they make it easier to see which direction data flows at a glance:
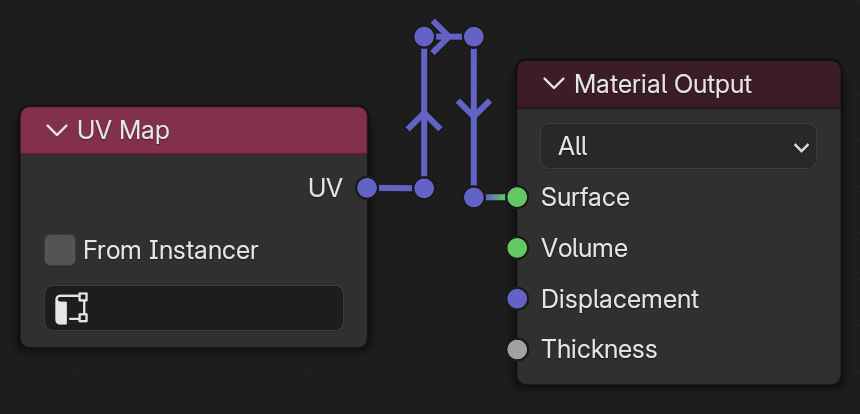
Adding Reroute nodes, these intermediate purple circles, has no impact on the video
Reroute nodes help you lay out materials more clearly
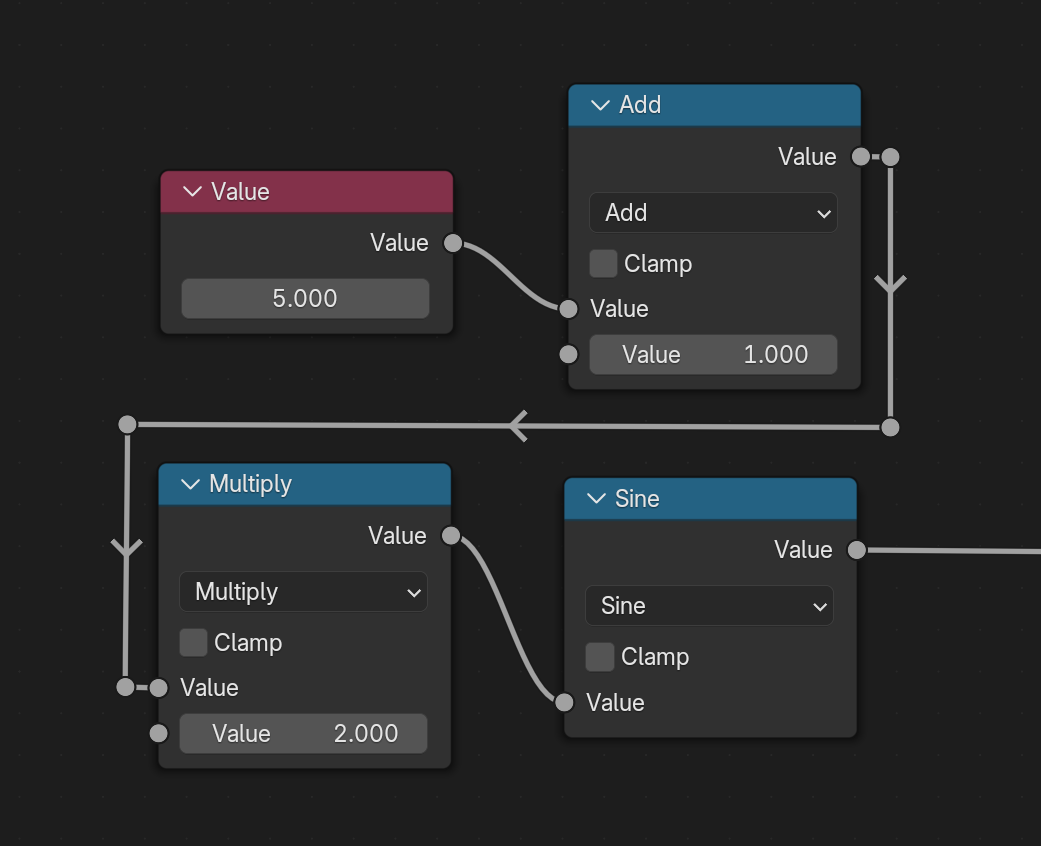
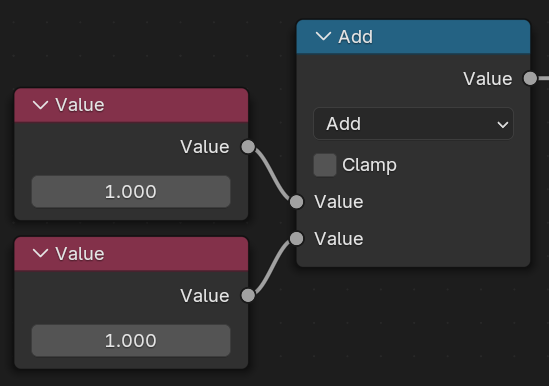
But wait, you say, when I hold a magnifying glass up to the first material, I see two pipes coming out of a node. And you said each node only gives off its data once but there are clearly two pipes coming out of that Value node:
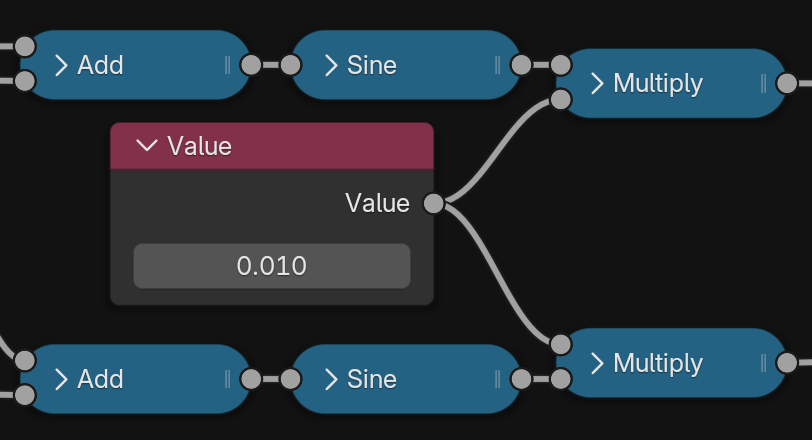
Yup. True. Let me rephrase how data flows: the node will give out data once for each pipe coming out of it (for each frame, for each part of the screen). So the two nodes named Multiply here will each receive the value 0.010 from that Value node.
Let's go back to the material we created above that has only UV Map and Material Output as a specific example:
Blender starts from the Material Output, sees that the Surface input has an incoming data pipe. So, before Material Output can do anything, it first has to know what data is coming from that pipe (from UV Map). UV Map emits a single vec3 and because Blender has a convenient magical conversion from vec3 to the green one (closure), it will display the vec3 from UV Map as a color. As you might have guessed from the example I referenced from part 1, every frame of the animation with this material will look like this:
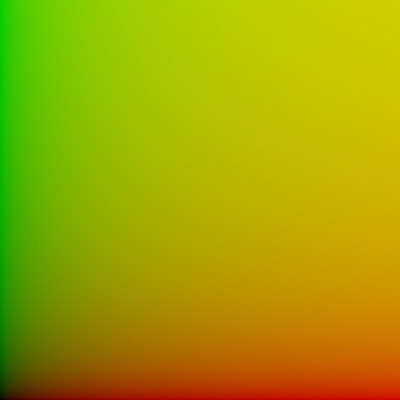
Surpising!?? No? That's good. Let's do something less trivial. We're going to make green into red and red into green:
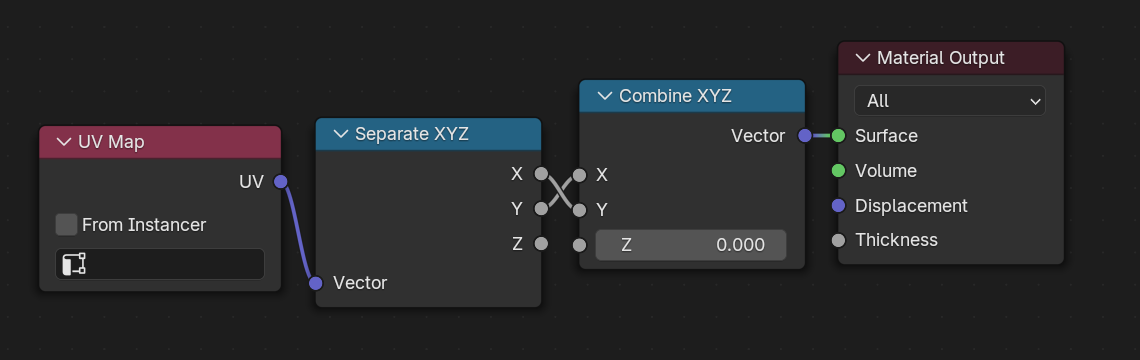
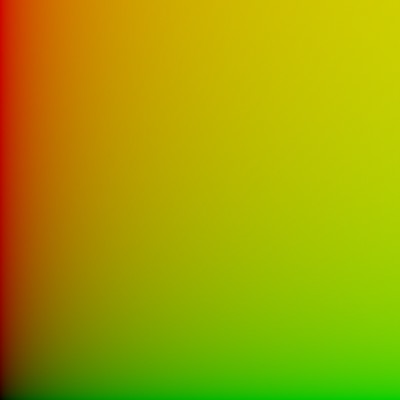
Now we're getting somewhere. How does it work? The Seperate XYZ node is similiar to our getting .x .y .z from a vec3 in part 1. And the Combine XYZ node is like calling vec3(x, y, z), only here, we've switched up the X and Y, so the expression is more like vec3(uv.y. uv.x, 0.0) (notice how the uv.z is unused from Separate XYZ and we replace it with an identical 0.0 value). Last, we pass this to Material Output to use as a color.
To review, the Value node can be used to create floats and Combine XYZ node can be used to create vec3s.
time in Blender
In part 1, I had this whole spiel about using time as the only source of motion:
We will create motion by using time. I am a bit of a purist and like to design my psychedelic graphics so all changes and movement are derived from the single value time. This is not a requirement, but I think it's beautiful.
And this article will be no different. However, time is not something you just have. I had to write some code to get the number of seconds since you opened the webpage in your browser and make it available as time in the interactive examples, the same way I made the rolling hills image available with painting. Similarly, time doesn't really exist in Blender. Blender only makes it possible to get the current frame in the animation using Drivers, a system I will touch on later.
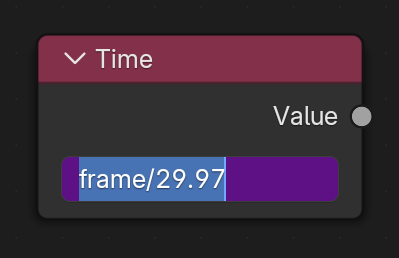
I've used the frame from the Drivers system and divided it by 29.97 because 29.97 is the number of frames per second of the original jellyfish video and therefore the frames per second I'd like our final video to be. When you start playing the animation in Blender, the data from this Value node will automatically update on each frame.
Important Note: Your final video does NOT have to have the same framerate as the input. Changing the effects you apply at 60 frames per second, for example, when your original video is only 24 frames per second will actually make it look more fluid. However, unless you speed up the video, it will still play at the same rate. Similarly, your final video can be a higher resolution than your input video, but unless you apply effects to warp the video to create a sense of smoothness, the final video won't seem to gain any quality.
We used sin(time) quite a lot in part 1. Here's what it looks like using the time node I created just above and a Math node with Sine selected (the title of the node will say Sine even though it's still a Math node). Note how the value of time changes:
If you have the panel open in Blender showing what is being produced by Material Output, it will look like this:
color = vec3(sin(time), sin(time), sin(time)) in Blender
In part 1, we could write color = vec3(sin(time), sin(time), sin(time)) and that's essentially the material we created above. When time moves along the sin curve into the values below 0.0, the color will be shown as black, vec3(0.0, 0.0, 0.0). When it's positive, it will transition from black towards white, maxing out at vec3(1.0, 1.0, 1.0).
Arithmetic with float and vec3
Just like in part 1 with +, -, *, /, mod, floor, there are nodes that enable you to transform numbers in various ways. Here's what addition looks like:
1 + 1 in Blender
Using these nodes that just take in starting data like the Value node is so common that all nodes let you just write those data directly inside them:
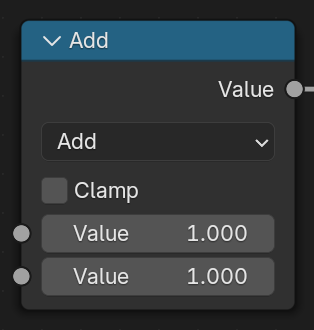
Also 1 + 1 in Blender
Unlike the code we saw in part 1, transforming numbers in vec3 and float requires different nodes in Blender. To add two vec3s, you need a Vector Math node with the Add option selected:
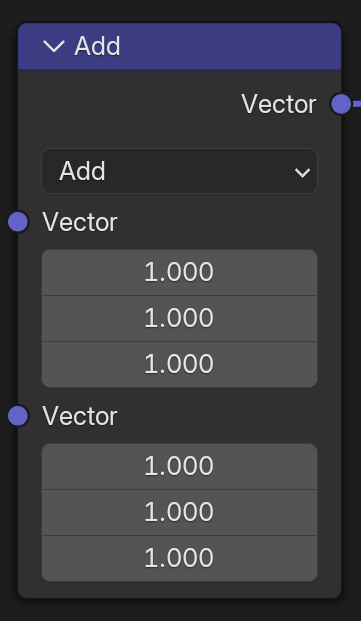
vec3(1.0, 1.0, 1.0) + vec3(1.0, 1.0, 1.0) in Blender
Often, for convenience, you'll want to add or multiply by the same value for each value in the vec3 (.x, .y, .z). Something like vec3(1.0, 1.0, 1.0) * 5.0 (this is called scalar multiplication). To accomplish this, you just need to connect the float value into the node and Blender will copy it to each part of a vec3:
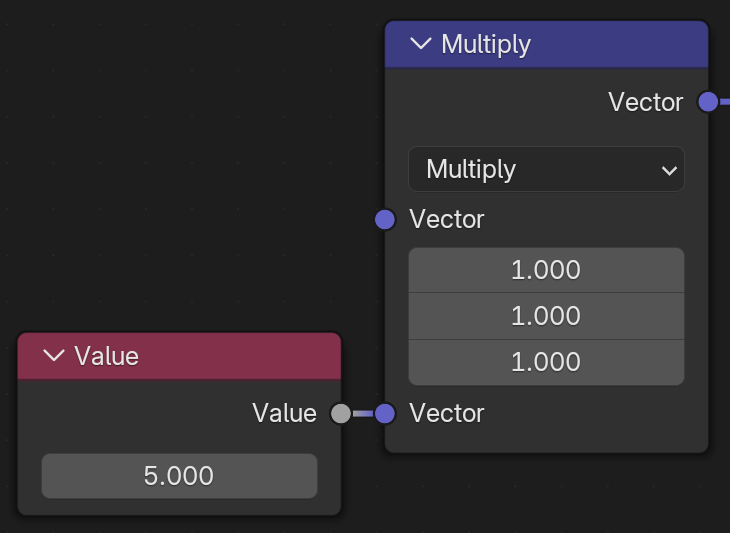
vec3(1.0, 1.0, 1.0) * 5.0 in Blender
So above, the 5.0 from the Value node will turn into vec3(5.0, 5.0, 5.0) and the result of the multiplication will be vec3(5.0, 5.0, 5.0).
Messing with the UVs
Let's go back and look at the finished material from the beginning of the article:
In order to fit it all in one image, I minimized each of the nodes. Let's go over each part, as we should know enough to understand most of it now.
First, we distort the UVs in the top portion, just as we did in part 1. At the beginning, the UV Map node (which I've renamed to UV for convenience) emits a vec3 that's exactly like the uv from part 1, only it's a vec3 with the .z field set to 0.0.
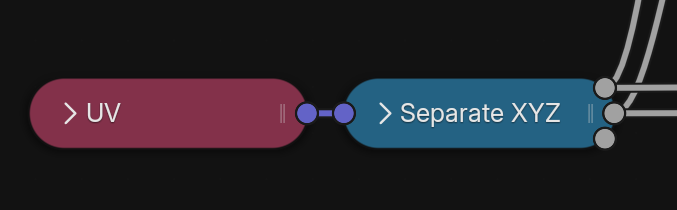
We use the Separate XYZ node to get the .x and .y values and work with them separately. This part is also identical to part 1. In part 1, we had:
uv.x = uv.x + sin(time + uv.x * 50.0) * 0.01;
uv.y = uv.y + sin(time + uv.y * 50.0) * 0.01;
Now we have something equivalent in Blender:
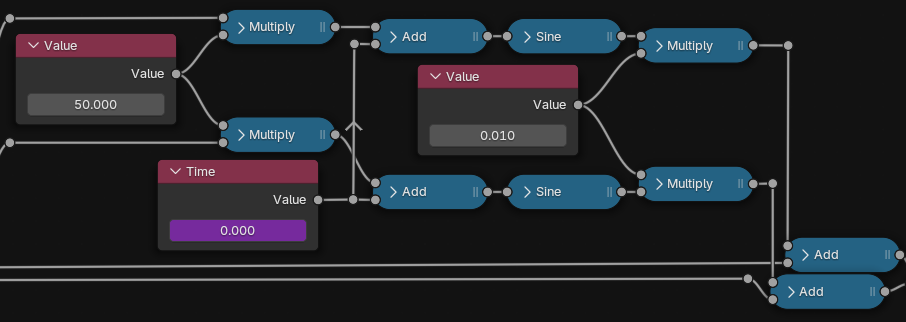
The expression uv + sin(time + uv * 50.0) * 0.01
The top Multiply, Add, Sine, Multiply, Add are for the .x and the bottom ones are for the .y.
Chromatic Aberration UVs
Now, here is where we diverge from the final code in part 1. In part 1, there was an example on how to create chromatic aberration, where the red, green, and blue split:
We use a similiar technique here. It looks complicated in Blender, but it's not too dissimilar from what we did above.
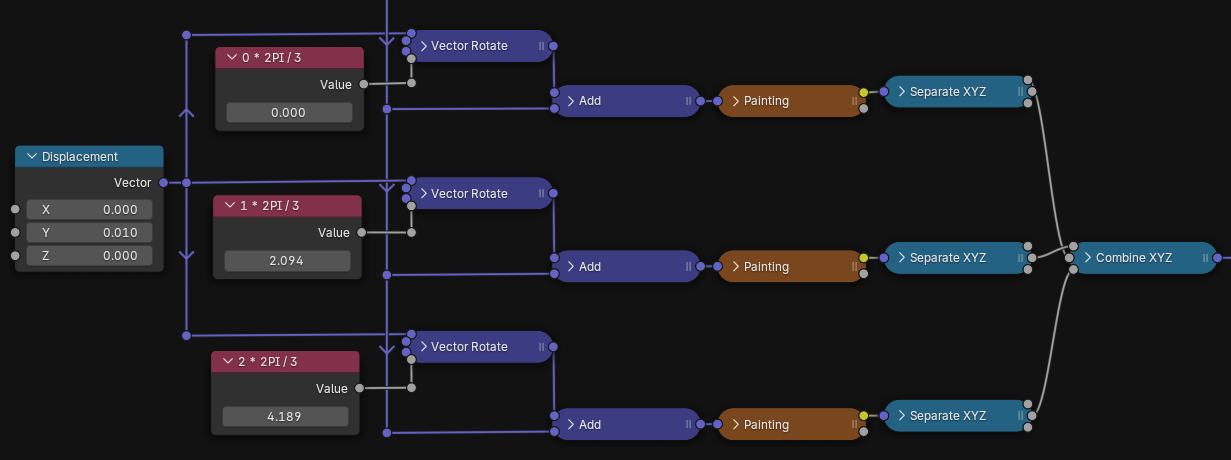
The expression uv + sin(time + uv * 50.0) * 0.01
The Displacement on the left is just a Combine XYZ node that I renamed. In the interactive example above, we are using vec2(0.0, 1.0), vec2(0.866, -0.5), and vec2(-0.866, -0.5) because they correspond to pointing straight up, down to the right, and then down to the left, as if we're splitting a pie into thirds. Here's the diagram from part 1:
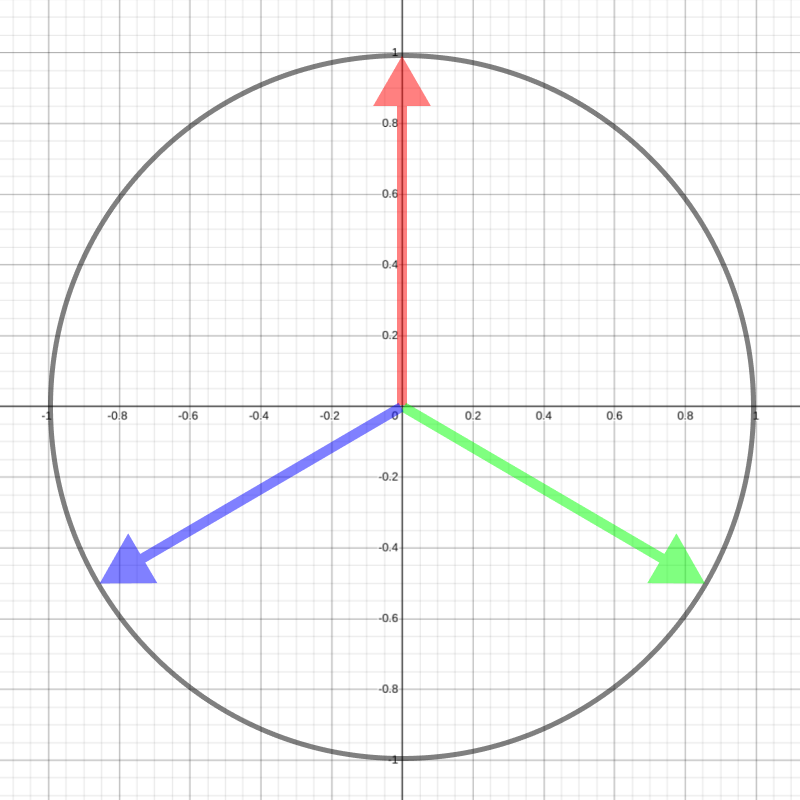
The red, green, and blue UV coordinate are pushed in different directions
Each of the three horizontal paths on the bottom correspond to one of red, green, or blue. Let's look at one. The colored arrows from above are created by taking an arrow pointing up (the Displacement) and rotating it by a different amount for each color. Here's a simplified version of how we're creating the red arrow:
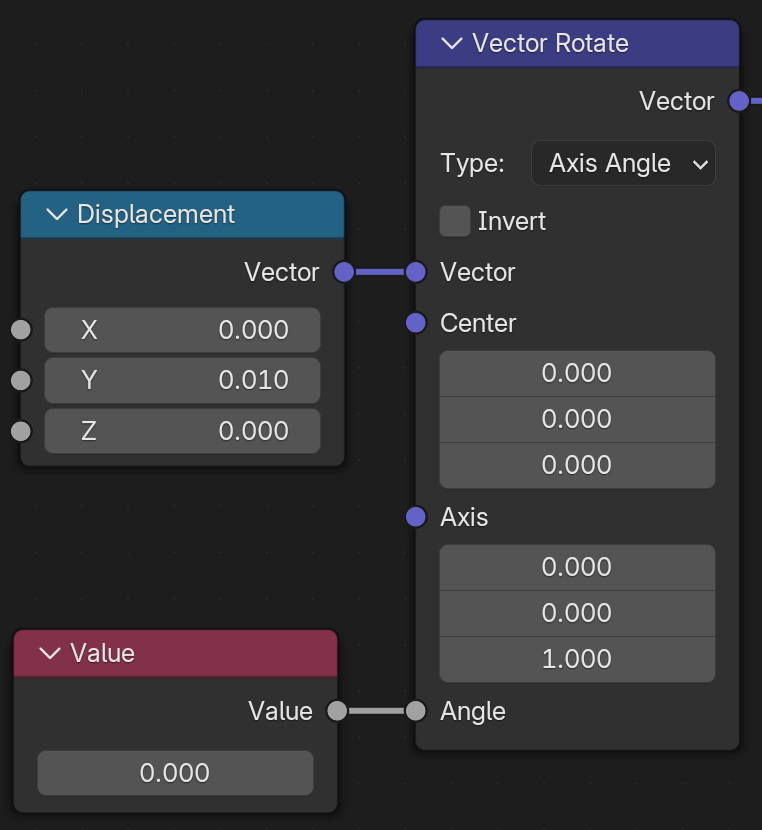
Rotating the vector vec3(0.0, 0.01, 0.0) by 0.0 degrees
As we saw in part 1, if you move the red, green, and blue UVs before passing to painting by 1.0, that's a huge gap! The colors will be split a whole screen's worth of distance and it will be hard to identify it as chromatic aberration. So, instead of starting with an arrow pointing up by 1.0, we're using 0.01 as the displacement, the amount we want to push each color away from where it starts.
Next, we rotate this displacement because, eventually, we will add it to the UV coordinates for each of the red, green, and blue UV coordinates, as this is what chromatic aberration calls for. The Vector Rotate node expects the angle of rotation to be in radians. If you don't remember what radians are, just remember that 0° is 0 radians and 360° is about 6 radians. So one third of that is about 2 radians and two thirds is about 4 radians.
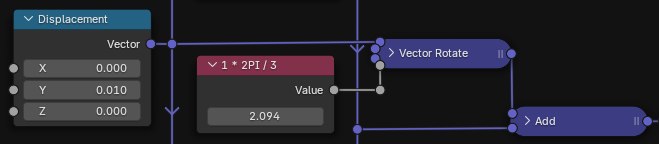
These Value nodes for the red, green, and blue control the rotation of the displacement and therefore the direction that each color is pushed away. Above, the rotation of the green color is being adjusted while the other two colors remain the same
A full 360° rotation (about 6 radians) would put as back to where we started. We only want the direction each color's UVs move by to be rotated one third around the circle from the others. The displacement for the red is rotated 0° (0.0), the green displacement is rotated one third around the circle/120° (about 2 radians), and the blue displacement is rotated two thirds/240° (about 4 radians).
If that doesn't make sense, look at the red, green, and blue arrows above and ask yourself what rotation you'd apply to the red arrow around the center to get to the green arrow.
Finally, we add the displacement for each color to the UV coordinates from the top half of the material. Here's how the green UV coordinates are changed:
The UV coordinates for green are shifted down and to the right. We do this by taking a vector pointing upwards and rotating it 120° clockwise, then adding it to the original UV
Chromatic Aberration Texture
Remember the painting from part 1? You'd look up what color the painting was at a specific UV location. Well, now the painting is a video. The painting will change. It will change as the video progresses. If you unminimize one of nodes named Painting (it is actually an Image Texture node that I renamed for convenince), you'll see this:
Like the Value node we created to track time, this Painting node also uses some magic with Drivers (which I still haven't explained) to change that painting on the wall so it's showing the part of the video (the current frame in our animation):
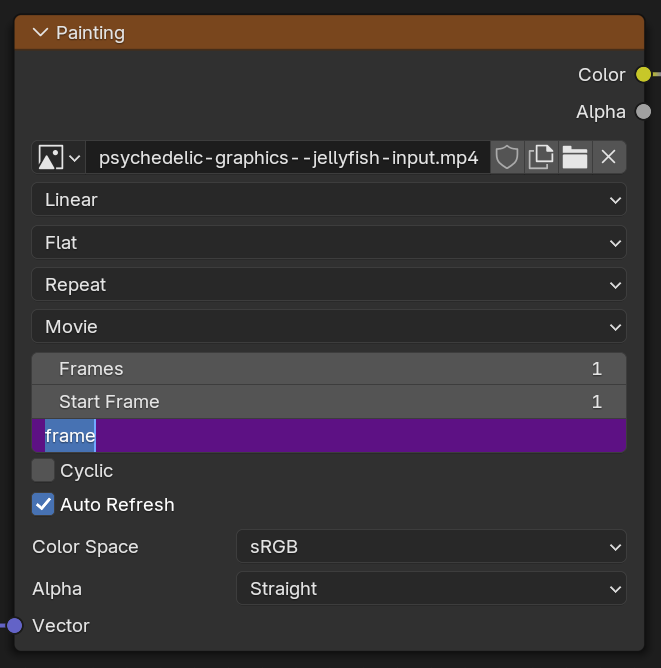
If you click on Offset in this node, it will reveal what's determining the value
Why couldn't we use the time Value node we created here? Because Blender doesn't make that input (Offset) available to receive data 😢. I don't know why. Honestly, I don't understand the Drivers system very well either.
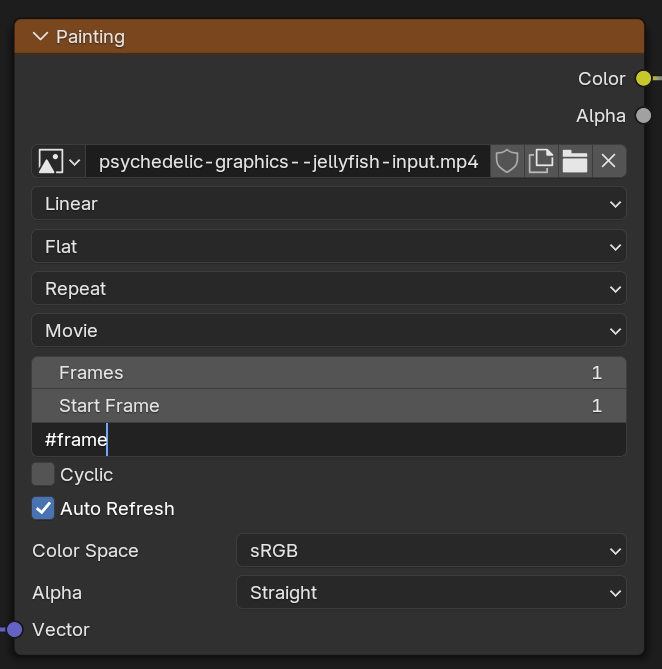
I do know that the Drivers system lets you create values with names and use them to change other values in Blender. In our case, frame is automatically defined for us by Blender, but you can essentially create your own and change their value as you'd like over time in your video. If you want to make a value in a Blender node always be equal to frame, the fastest way I've found to do that is to first type #frame as the value of the field and hit Enter:
That's it. And with that, it seems like our video is getting close to done. The only thing left is to do this part from our interactive example above:
color = vec3(
painting(red_uv ).z,
painting(green_uv).y,
painting(blue_uv ).x
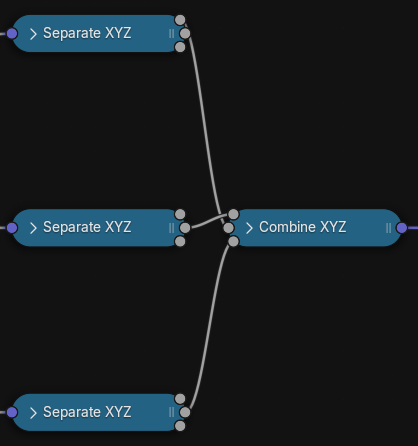
);Hmm, but the output from this node called Painting is yellow. That's a Color. Don't worry too much about the difference between Color and vec3. Blender will gladly convert that Color to a vec3 for us if we pass it to a node that needs one. To get the .x, .y, or .z for a vec3 in Blender, we pass it to a Separate XYZ node and connect one of its three float outputs.
Here, I just played around with connecting different outputs from the Separate XYZ to different inputs on the Combine XYZ until I got a combination that I found visually appealing. In the end, the red's red is used as green, the green's green is used as red, and blue's green is used as blue 🤦:
In part 1, we would write this like:
color = vec3(
    painting(green_uv).y,
    painting(red_uv  ).x,
    painting(blue_uv ).y
);
Do mess with time
We're not done though. Look at the final output in the original again:
It's like there's some echo or stop motion or something weird going on. If you click on Offset on Painting for green, you'll find something like this 😱:
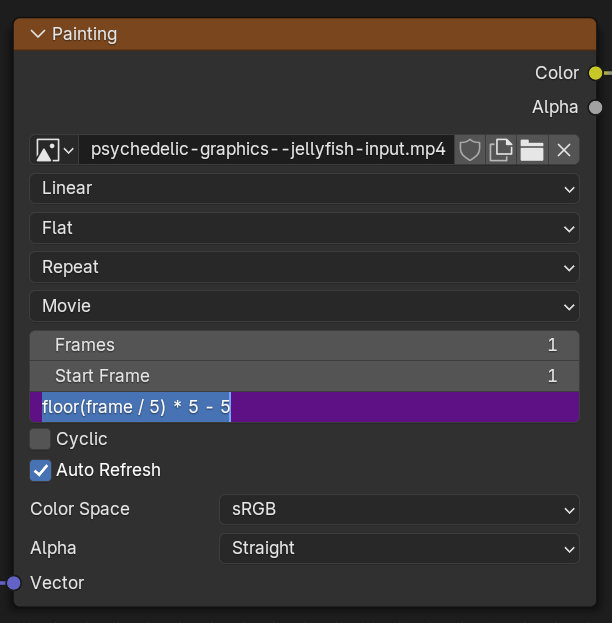
The green is messing with time. Specifically, it's only showing the first frame of every five frames, then going back in time
This is where Blender shines! This is one feature that is SO cool. In your Drivers, you don't have to use the exact value you're given (here, frame). If you recall all the talk about floor in part 1, what this expression, floor(frame / 5) * 5, is doing is rounding the frame to the nearest 5 (0, 5, 10, ...) and then subtracting 5 afterwards. That means that the painting we're using for the green will have a fifth the framerate as the one for red and always be 5 frames behind the red. It really is like an echo.
For blue, it's a full 30 frames behind the red with an even bigger rounding number (10):
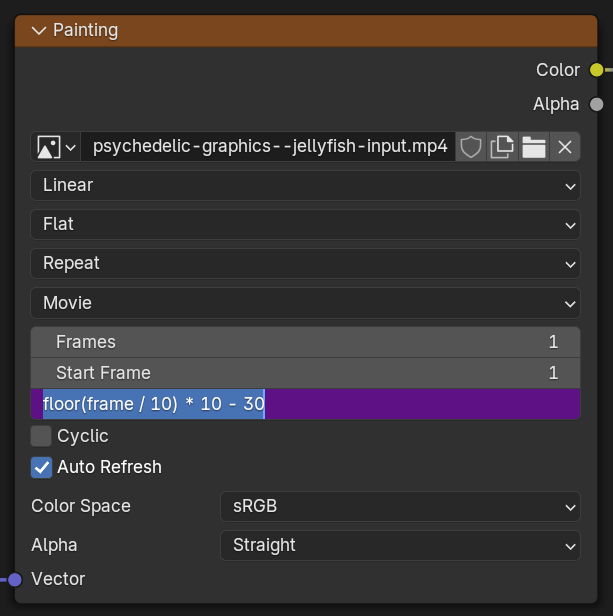
The blue is messing with time even more. Specifically, it's only showing the first frame of every ten frames, then going back in time
That means that the colors coming from blue will effectively be a full second behind the red (at 29.97 frames per second). And a tenth the framerate. That's crazy! I love it!
You can use frame however you'd like. Want one color to go backwords? Just set it to the total number of video frames minus frame: 237 - frame. Want it to go slower? Just divide by some value: frame / 3.0. Do you want it to follow sin? Just multiply it out: (sin(frame) * 0.5 + 0.5) * 237 (sin(frame) * 0.5 + 0.5) is basically sin01(frame)).
It's so cool. Ulysse was too busy messing with time, he never stopped to ask if he should mess with time. And now what he's thought about, he's decided it's a great idea! Mess with time yourself as you please and let me know how it goes!
Important Note: From my experience, using multiple Image Texture nodes (the Painting node) on different frames requires loading in the video separately for each node (Blender will add something like .001 to the end of the filename to distinguish them). For computers with lesser hardware, this might make it pretty difficult to preview your animation at a decent framerate as you're working.
Rendering
To load in your own video, click on the folder icon in the Painting node next to the filename of the currently loaded video. Remember to adjust the framerate to match your video and change any other values in the Output panel (output size, total frames) on the right as you'd like. Then click on Render > Render Animation at the top.
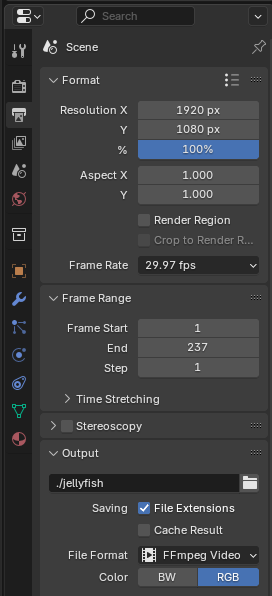
Depending on your GPU and output size, sometimes rendering won't take too much longer than it would to actually watch the video (faster with a decent GPU and at lower resolution).
If you've made it this far, you've understood a lot and hopefully developed some intuition for how to reproduce some of what we discussed in part 1, but in Blender. Thanks for giving me a few minutes of your time! Would love to hear your questions, comments, or how you're using these ideas in your own work: ulysse at benpence.com.